
Gum disease is one of the most underdiagnosed conditions in dental clinics across India. Many patients walk in for a routine cleaning, unaware that bone loss is already underway beneath the gumline. For dental professionals, the single most powerful tool for catching periodontitis early is something deceptively simple: a consistent, accurate periodontal chart. Mastering periodontal charting does not just improve clinical outcomes — it builds the kind of trust that keeps patients coming back and referring others to your practice.
Why Periodontal Charting Is a Non-Negotiable Diagnostic Step
Periodontal disease follows a predictable but insidious path. It starts as gingivitis — reversible, silent, and easy to dismiss — before progressing to periodontitis, where bone and attachment loss become permanent. The transition happens gradually, and without systematic documentation, even experienced clinicians can miss the turning point.
A complete periodontal chart gives you a snapshot of the entire periodontium at a single point in time. More importantly, it gives you a baseline. When you compare a new chart against one taken six months earlier, you are not guessing whether a patient is improving or deteriorating — the numbers tell you directly. This is the foundation of evidence-based dental practice management, and it is the kind of data that transforms a reactive clinic into a proactive one.
The Six Measurements Every Periodontal Chart Must Include
A thorough chart captures far more than probing depths. Here is what to record at every assessment:
- Probing Depth (PD): The distance from the free gingival margin to the base of the sulcus or pocket, recorded at six sites per tooth. Healthy sulci measure 1–3 mm. Anything deeper, especially with bleeding, warrants closer attention.
- Clinical Attachment Level (CAL): The true measure of periodontal destruction. CAL accounts for both the pocket depth and the position of the gingival margin relative to the cementoenamel junction (CEJ). It is the most reliable indicator of cumulative bone loss over time.
- Bleeding on Probing (BOP): A positive BOP score at multiple sites is one of the strongest clinical signs of active inflammation. Tracking BOP percentage across appointments lets you measure the effectiveness of scaling and home care.
- Gingival Recession: Recession exposes root surfaces, increases caries risk, and directly factors into CAL calculation. Do not skip it, even when pockets appear shallow.
- Furcation Involvement: For molars and some premolars, record furcation class (I, II, or III) at each affected site. Through-and-through furcation involvement dramatically changes prognosis and treatment options.
- Tooth Mobility: Grade I through III mobility helps distinguish periodontitis-related bone loss from occlusal trauma — a distinction that matters for treatment planning.
Suppuration, plaque and calculus indices, and radiographic bone levels should accompany the chart for a complete diagnostic picture. Radiographs and charting are not interchangeable; they answer different clinical questions and must be read together.
Technique Details That Separate Accurate Charts from Guesswork
The reliability of a periodontal chart depends almost entirely on technique. Small inconsistencies compound across six sites per tooth, twenty-eight teeth, and multiple appointments — and they can mask real disease progression or create false alarms.
Use a standardised probe with clear millimetre markings (UNC-15 or Williams probes are widely available in India). Walk the probe circumferentially around each tooth rather than spot-probing, applying gentle, consistent pressure of roughly 20 grams — light enough not to cause pain in healthy tissue, firm enough to reach the base of a true pocket. Angle the probe parallel to the long axis of the tooth for most sites, then tilt slightly to access interproximal areas beneath contact points.
Consistent probing force is the hardest skill to develop and the one most often neglected in training. If your practice has multiple hygienists or dentists charting the same patients, periodic calibration exercises — where two clinicians independently probe the same patient and compare results — can reveal systematic differences that would otherwise go unnoticed in longitudinal data.
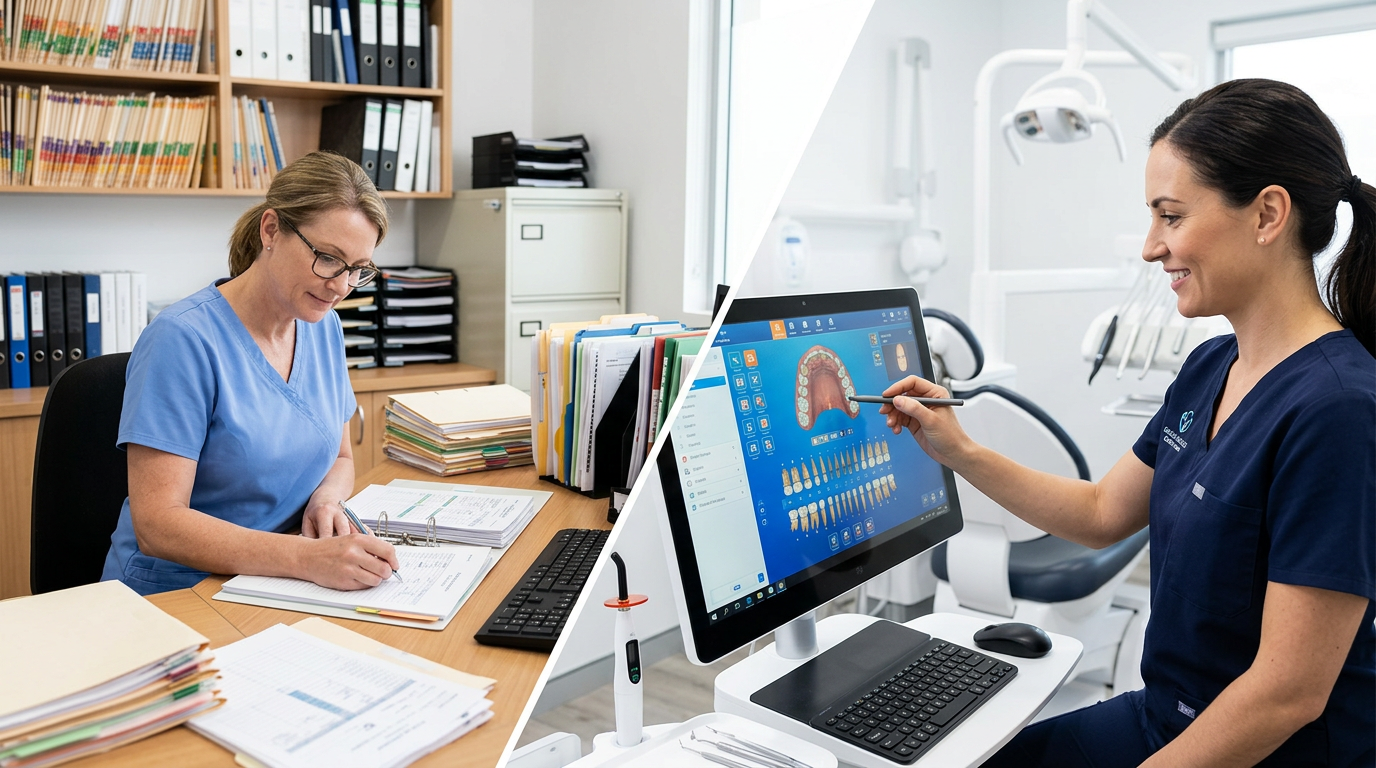
Record every measurement immediately. Relying on memory for even a few seconds while charting creates errors. This is one area where digital charting tools deliver a clear advantage over paper charts.
How Digital Tools and Dental Software Improve Charting Accuracy
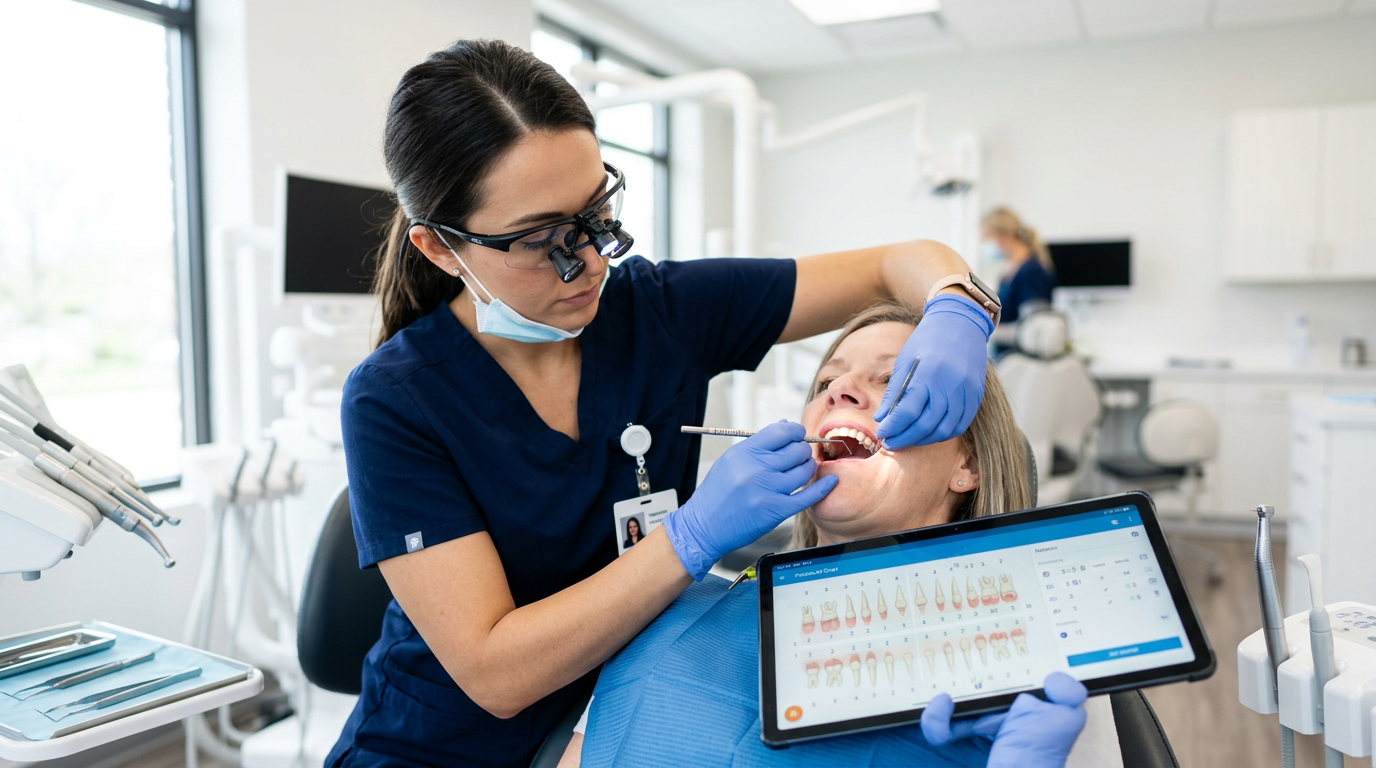
Dental software designed for Indian practices has matured significantly, and periodontal charting modules are one of the areas where the difference between digital and paper is most visible. A good digital charting tool eliminates transcription errors, calculates CAL automatically from your inputs, and generates colour-coded visual reports that make it easy to explain findings to patients.
Voice-input charting — where a clinician calls out measurements and the software records them — keeps both hands free and reduces the contamination risk that comes from repeatedly touching a keyboard mid-procedure. Longitudinal overlays let you place the current chart side-by-side with a previous one, immediately highlighting sites where pockets have deepened or attachment has been lost.
Platforms like Denti360 integrate periodontal charting directly into the patient record, so the data flows into treatment planning, recall scheduling, and clinical notes without any manual re-entry. For dental practice management in India, where clinic teams are often lean, that kind of workflow efficiency is not a luxury — it is what makes comprehensive charting sustainable day to day.
Automated probes that deliver a calibrated, constant force represent the next level of precision, though they remain less common in Indian practices. As dental technology adoption grows, these tools will increasingly find their way into periodontal-focused clinics and specialist centres.
Reading the Chart: Patterns That Point to Early Disease
A completed chart is only useful if you know how to interpret it. Rather than looking at individual readings in isolation, look for patterns:
- Generalised BOP with shallow pockets suggests plaque-induced gingivitis — reversible with professional debridement and improved home care.
- Pocketing of 4–5 mm with BOP at posterior interproximal sites is a classic early periodontitis presentation that patients often have no awareness of.
- Isolated deep pockets at a single tooth may indicate an endo-perio lesion, a vertical fracture, or a localised aggressive lesion — each requiring a different management approach.
- Increasing CAL on serial charts is the clearest evidence of ongoing disease activity, regardless of what the pockets look like at a single point in time.
- High mobility without proportionally deep pockets points toward occlusal trauma as a co-factor, which changes the treatment plan considerably.
Sharing these findings with patients using visual aids — colour-coded digital charts, intraoral photographs, and annotated radiographs — dramatically improves acceptance of periodontal treatment. When patients can see their own data, the recommendation for scaling and root planing or a periodontal referral stops feeling like upselling and starts feeling like the logical next step.
Building a Consistent Charting Culture in Your Practice
The biggest barrier to reliable periodontal data is not skill — it is consistency. Many Indian clinics chart only when a patient presents with an obvious complaint, rather than at every periodic examination. This approach guarantees missed diagnoses, because periodontitis rarely announces itself with pain until the late stages.
Set a protocol: full-mouth periodontal charting at every new patient examination and at every annual or biannual recall for adults. For patients already diagnosed with periodontitis, chart at every active treatment visit and at every supportive periodontal therapy appointment. Document your protocols in writing, train every team member who touches patient records, and use your dental software to flag patients who are overdue for a charting update.
Over time, this systematic approach creates a rich dataset that benefits individual patients and helps you understand the oral health trends across your entire practice — the kind of insight that supports confident clinical decisions and positions your clinic as a practice that takes gum disease seriously.
Conclusion
Periodontal charting is not paperwork — it is the clinical foundation on which early gum disease detection, treatment planning, and long-term patient care are built. Mastering the technique, recording all relevant parameters, interpreting patterns across serial charts, and using dental software to make the process efficient are the steps that separate practices delivering adequate care from those delivering exceptional care.
If your clinic is ready to bring its periodontal workflows into the digital era, Denti360 offers an integrated dental practice management platform built for Indian dental professionals. Book a free Denti360 demo and see how seamless periodontal charting, patient records, and recall management can work together in your clinic.